A diabetes complication that went unaddressed. A respiratory flare without a follow-up appointment in place. An infection that escalated because a patient couldn't reach their provider. These may appear as isolated issues, but zooming out, it’s clear there’s a systemic pattern. Every day, patients who receive Medicaid benefits across the country end up in the emergency room or admitted to a hospital for conditions that could have been managed with timely outpatient care.
But the problem doesn't look the same everywhere. One of the more striking findings in Waymark's peer-reviewed analysis of state-level Medicaid claims data is the dramatic variation in avoidable acute care rates across states. Mississippi has the highest rate of avoidable acute care in the dataset at 44.2%, nearly 10 percentage points above Pennsylvania's 35.1%. That gap translates directly to cost: Mississippi spends $30 per member per month on avoidable care, while Pennsylvania spends $21. There’s a similar gap between Louisiana ($28 PMPM) and Montana ($15 PMPM). In California alone, the total annual avoidable spend exceeds $1.7 billion.
The causes of these gaps are a complex mix of structural factors: differences in primary care access, community health infrastructure, how Medicaid programs are administered, and how well health plans and care management teams are reaching the patients most at risk before a crisis occurs. But the opportunity is consistent and quantifiable.
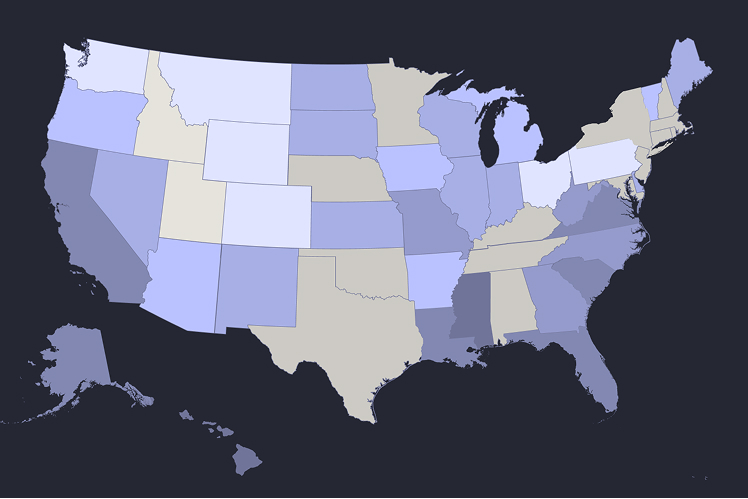
We've built an interactive map that shows avoidable acute care rates and spending for every state in our dataset. Mouse over any state to see its current avoidable care profile, including total Medicaid enrollment and annual spending on preventable acute care. States are colored by their avoidable care rate – darker colors indicate higher percentages of acute care that could have been prevented with better outpatient management.

Some of our key takeaways from this map:
- Geographic clustering: States in the Southeast and parts of the Midwest show consistently higher avoidable care rates, while Western states tend toward lower rates.
- Scale of opportunity: Large states like California, Florida, and Ohio each have hundreds of millions in annual preventable spending, while smaller states face tens of millions in avoidable costs.
- Variation within similar demographics: States with comparable Medicaid populations can have dramatically different avoidable care rates, suggesting that delivery system factors – not just population health – drive outcomes.
These aren't inevitable outcomes. Waymark's peer-reviewed results, published in NEJM Catalyst, demonstrate that targeted, community-based care management can substantially reduce avoidable hospitalizations and ED visits among rising-risk Medicaid patients, including:
- 22.9% reduction in all-cause acute events
- 48.3% reduction in ambulatory care–sensitive hospitalizations
- $2,347 in savings per member per year
But the first step is understanding the scale and distribution of the problem in your state. If your state is on the map, the avoidable spend in your Medicaid population is quantifiable, and so is the opportunity to reduce it. Reach out to partnerships@waymarkcare.com to learn more about how Waymark can help.
Methodology
Data Source: This analysis uses state-level Medicaid claims data published in Waymark's peer-reviewed study in the American Journal of Managed Care (2024). The dataset covers 36 states representing approximately 41.3 million Medicaid beneficiaries—roughly 60% of total U.S. Medicaid enrollment.
Definition of Avoidable Acute Care: Hospitalizations and emergency department visits for Ambulatory Care Sensitive Conditions (ACSCs) as defined by the Agency for Healthcare Research and Quality (AHRQ) Prevention Quality Indicators. These are conditions for which timely and effective outpatient care can prevent or reduce the need for hospital-based treatment, including diabetes complications, chronic obstructive pulmonary disease (COPD) exacerbations, congestive heart failure, bacterial pneumonia, urinary tract infections, and dehydration.
Calculation Methodology: For each state, current annual avoidable spend is calculated as:
- Avoidable ED Spending = (ED visits for ACSCs per 1,000 member months × Total member months × $750 average cost per visit)
- Avoidable Hospitalization Spending = (Hospitalizations for ACSCs per 1,000 member months × Total member months × $1,245 average cost per admission)
- Total Medicaid Members are calculated by dividing total member months by 12 to arrive at average monthly enrollment.
Geographic Coverage: The 36 states included in this analysis were selected based on data availability and quality from CMS claims databases. While not comprehensive, they represent a substantial and geographically diverse sample of U.S. Medicaid programs.
Limitations: This analysis shows baseline avoidable acute care utilization and spending. Actual opportunities for reduction will vary based on each state's specific delivery system characteristics, existing care management programs, population risk profiles, and other local factors. The data reflects system-wide averages and does not account for differences between health plans, managed care organizations, or fee-for-service populations within each state.